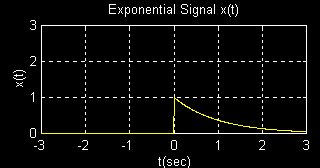
This demonstration uses the one-sided, real, decaying (b > 0) exponential signal
| A downloadable zip-file for execution on Matlab is available here. This permits interactive exploration of properties of spectra using various example signals. If you are familiar with the transformations below, go directly to the zip-file. |
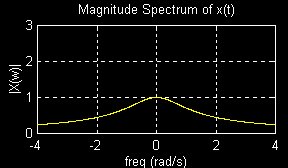
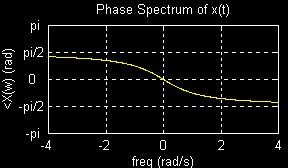
Plots of the exponential signal
x(t) =
e-tu(t)
(a=1, b=1) and the corresponding spectra are shown below:
You can select transformations on this signal, and view the effects on the spectra:
Amplitude Scale y(t) = ax(t) = ae-tu(t)
Time Shift y(t) = x(t - to) = e-(t - to) u(t - to)
Time Scale y(t) = x(bt) = e-btu(bt) = e-btu(t)
Time Truncation y(t) = x(t) = e-tu(t) for |t| < T, and y(t) = 0 for |t| > T
Also, you can select transformations on the spectra, i.e. on the Fourier transform, and view the effects on the signal:
Frequency Scale Y(w) = X(cw)
Ideal Filtering
Y(w) = X(w) for |w| < W, and Y(w) = 0 for
|w| > W
![]() return to demonstrations page
return to demonstrations page